In the investment world, tools and techniques are used to analyse and predict asset prices. One such tool is the Exponential Moving Average (EMA), a popular and influential indicator that helps traders and investors make informed decisions. Let us learn the EMAs, exploring what they are, how they work, and their applications in financial analysis.
A moving average is a computation through statistical calculation used to analyse data over a specific period to smooth out fluctuations and reveal trends. The Exponential Moving Average, in contrast to conventional moving averages, elegantly accords greater significance to the most current data points. Unlike the Simple Moving Average (SMA), which treats all data points equally, the Exponential Moving Average prioritises the most recent information. It makes it a more responsive indicator.

Working
To derive the EMA, we employ the ensuing mathematical expression:
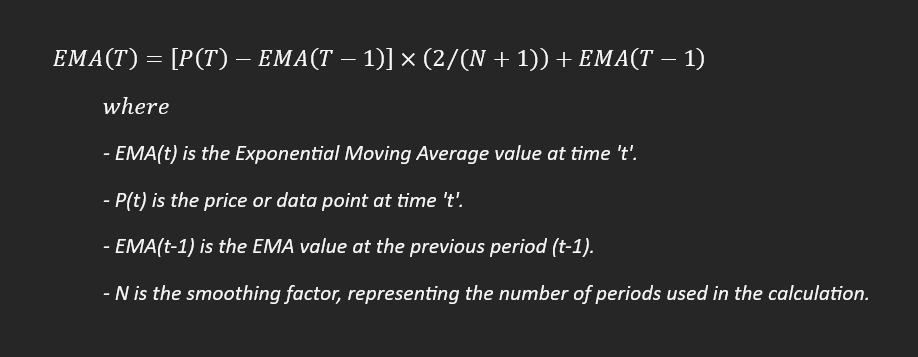
The EMA formula takes into account both the most recent data point (P(T)) and the previous EMA value (EMA(T-1)) to calculate the current EMA. The smoothing factor (N) determines how much weight is assigned to the most recent data point, with higher values making the EMA more responsive to recent changes.
Key Characteristics
1) Responsiveness – EMAs react more quickly to price changes than SMAs. It makes them a valuable tool for short-term traders and investors who want to capitalise on recent price movements.
2) Weighting Recent Data – EMAs give more weight to the most recent data points, reflecting the belief that current data is more relevant to predicting future prices.
3) Smoothing Effect – Despite their responsiveness, EMAs still provide a smoothed representation of price data, making them helpful in identifying trends over time.
Applications
1) Identifying Trends – EMAs are commonly used to identify trends in financial markets. When the price is consistently above the EMA, it can indicate an uptrend, while a price below the EMA suggests a downtrend.
2) Entry and Exit Points – Traders use EMAs to determine optimal position entry and exit points. A crossover of short-term and long-term EMAs (e.g., 10-day and 50-day EMAs) can signal potential buying or selling opportunities.
3) Support and Resistance Levels – Traders can use EMAs as dynamic support and resistance levels to identify potential price reversals in an asset.
4) Risk Management – EMAs can be used to set stop-loss orders, allowing traders to limit potential losses in a volatile market.
Summary
Exponential Moving Averages are a vital tool for traders and investors seeking to make informed decisions in the financial markets. Their ability to provide a balanced view of recent price movements while smoothing out noise makes them a valuable indicator for trend analysis, entry and exit strategies, and risk management.
When using EMAs, it’s essential to understand the trade-off between responsiveness and reliability. Shorter-term EMAs respond quickly to market changes but may generate more false signals, while longer-term EMAs provide a more stable trend but might miss some shorter-term opportunities. By incorporating EMAs into your analytical toolkit and considering your investment horizon and risk tolerance, you can harness the power of these exponential moving averages to enhance your financial decision-making.
Disclaimer: We do not endorse or encourage you to take trades or investment decisions based upon our posts/research, all of your trading and investment activities are your own and should be taken through consultation with reputed financial advisors. The analysis posted on this website has been created by involving multiple mediums which are present over the Internet.