In the highly competitive finance industry, individuals engaged in trading and investing constantly seek an advantage to make informed decisions. One such tool that has gained popularity over the years is the Fisher Transform Indicator. This indicator, developed by John F. Ehlers, is renowned for transforming price data into a Gaussian distribution, making it easier to identify potential trend reversals and trade entry points. Let us understand the Fisher Transform Indicator by exploring its calculation, interpretation, and practical applications in trading.
Exploring the Fisher Transform Indicator
The Fisher Transform Indicator primarily identifies overbought and oversold conditions in a financial instrument. It achieves this by converting the price data, which usually follows a non-normal distribution, into a normalized distribution that closely resembles a Gaussian (normal) distribution. This transformation helps traders identify potential turning points in the market.
Calculation of the Fisher Transform Indicator
To compute the Fisher Transform Indicator, follow these steps –
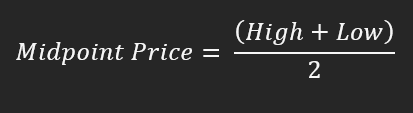
1) Calculate the midpoint price and the average high and low prices for a given period:
2) Compute the natural logarithm of the ratio between the current midpoint price and the midpoint price from the previous ‘n’ periods:

3) Figure the Fisher Transform value using the following formula:

The result is a value that oscillates between -1 and 1, representing extreme bearish and bullish conditions, respectively.
Interpreting the Fisher Transform Indicator
The Fisher Transform Indicator generates signals based on overbought and oversold conditions
1) Crossovers – When the Fisher Transform crosses above 0.5, it indicates a potential bullish reversal or selling opportunity. Conversely, when it crosses below -0.5, it suggests a potential bearish reversal or buying opportunity.
2) Extreme Values – Extreme values above 1 or below -1 often signal that a market is overbought or oversold respectively. Traders may consider these extreme levels as potential reversal points.
3) Divergence – Divergence between the Fisher Transform and price can also be a valuable signal. If the price is making new highs while the Fisher Transform fails to surpass its previous high (bearish divergence) or if the price is making new lows while the Fisher Transform fails to reach its previous low (bullish divergence), it can indicate a potential reversal.

Practical Applications
1) Trend Reversal – The Fisher Transform can be a valuable tool for identifying trend reversals, helping traders enter or exit positions at opportune moments.
2) Filter for Other Indicators – Traders often use the Fisher Transform with other technical indicators to confirm signals and reduce false positives.
3) Risk Management – Extreme Fisher Transform values can serve as stop-loss or take-profit levels, aiding in risk management.
Summary
The Fisher Transform Indicator is a valuable tool for traders and investors to identify potential market reversal points. By transforming price data into a normalized distribution, it provides a unique perspective on market conditions. However, like any technical indicator, it could be better and should be used with other analysis methods and risk management strategies. As with any trading tool, practising and thoroughly understanding its application before incorporating it into your trading strategy is essential.
Disclaimer: We do not endorse or encourage you to take trades or investment decisions based upon our posts/research, all of your trading and investment activities are your own and should be taken through consultation with reputed financial advisors. The analysis posted on this website has been created by involving multiple mediums which are present over the Internet.