In the world of financial markets, traders rely on a multitude of indicators to make informed decisions. Among these, Connors RSI stands out as a powerful tool for assessing overbought and oversold conditions in a market. Developed by Larry Connors, this Relative Strength Index variant takes a unique approach to help traders identify potential trading opportunities. Let us explore the details of Connors RSI, its working, and practical usage for an advantage to traders.
Fundamentals
Connors RSI (Relative Strength Index) is a technical indicator that merges three crucial components:
1) Relative Strength Index (RSI) – RSI is a momentum oscillator that gauges the pace and alteration of price shifts. The range of this numerical value is between 0 and 100, commonly used to indicate overbought and oversold situations.
2) Rate of Change (ROC) – ROC calculates the percentage change in price over a specific period. It helps traders understand the velocity of price movements.
3) Up/Down Streak – This component assesses the number of consecutive up or down days in a given time frame. It provides insights into the recent trend’s strength.
Connors RSI is a composite indicator that combines these three components to provide a more comprehensive view of market conditions than traditional RSI alone.
Calculation
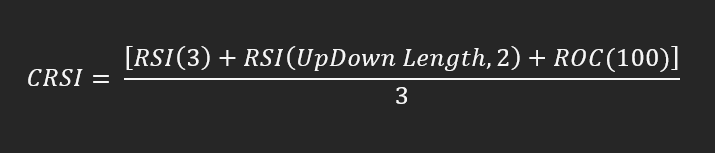
The formula for Connors RSI involves a few steps:
1) Calculate the RSI using the price data over a specified period.
2) Calculate the ROC over the same period.
3) Calculate the average of the RSI and ROC.
4) Calculate the smoothed moving average of the up/down streak.
The final Connors RSI value is derived from these calculations:
Interpretion
Unlike the standard RSI, which uses fixed overbought (70) and oversold (30) levels, Connors RSI dynamically adapts to current market conditions. The typical levels are 90 for overbought and 10 for oversold. However, these levels can be adjusted based on the trader’s preference and the characteristics of the asset being analyzed.
When Connors RSI crosses the overbought threshold, the asset might be in an uptrend and could be due for a pullback. Conversely, when it crosses below the oversold threshold, it indicates a potential opportunity for a bounce-back after a downtrend.

Applications
1) Identifying Potential Reversals – Connors RSI excels in identifying potential reversals in trends. When the indicator reaches extreme levels, traders can watch for signs of a reversal in price direction.
2) Confirmation Tool – Connors RSI is most effective when used with other technical and fundamental analysis tools. Its signals can be used to confirm signals from other indicators, increasing the confidence of a trading decision.
3) Adapting to Market Conditions – The dynamic nature of Connors RSI allows traders to adapt to changing market conditions. As volatility shifts, the indicator’s responsiveness ensures traders take advantage of potential opportunities.
Summary
Connors RSI is a valuable addition to a trader’s toolkit, offering a unique perspective on market momentum, trend strength, and potential reversals. By combining the RSI, ROC, and up/down streak components, this indicator provides a more comprehensive view of market conditions. As with any trading tool, it’s essential to thoroughly understand Connors RSI, practice using it, and consider it within a broader trading strategy.
Disclaimer: We do not endorse or encourage you to take trades or investment decisions based upon our posts/research, all of your trading and investment activities are your own and should be taken through consultation with reputed financial advisors. The analysis posted on this website has been created by involving multiple mediums which are present over the Internet.