In the dynamic world of financial markets, understanding and predicting market trends is crucial for traders and investors. To navigate the complexities of price movements, they rely on various technical indicators to gain insights and make informed decisions. One such powerful tool recently gaining popularity is the Triple Exponential Average (TRIX) indicator. TRIX offers a unique perspective on price momentum and trend reversals, equipping traders with valuable signals and enhancing their trading strategies.
Let us understand the TRIX concept by exploring its calculation methodology, interpretation, and practical application in trading strategies, to master utilising the TRIX indicator and efficiently identify potential market opportunities –
Understanding TRIX
The TRIX indicator is a momentum oscillator that reveals the rate of change of a triple-smoothed Exponential Moving Average (EMA). While traditional moving averages focus on price changes, TRIX takes it a step further by analysing the slope of the TRIX line, offering a deeper understanding of price momentum and potential trend reversals.
By employing TRIX, traders can gain an edge in identifying periods of accelerating or decelerating price momentum, allowing them to make timely trading decisions. TRIX provides valuable insights during technical analysis into market dynamics irrespective of your trading style.
Calculation of TRIX
The calculation of TRIX involves a three-step process, which begins with the computation of a single exponential moving average (SEMA) and progresses to the triple exponential smoothing:
- Calculate the first EMA – Start by computing a single EMA using the selected period. This initial EMA is often called the single exponential moving average (SEMA). It smoothes out the price data, providing a foundation for subsequent calculations.
- Calculate the second EMA – Next, calculate a second EMA using the same period on the previously derived SEMA. This second EMA is the double exponential moving average (DEMA).
- Calculate the third EMA – Finally, compute a third EMA using the same period on the DEMA obtained in the previous step. This triple exponential moving average (TEMA) is the core component of TRIX.
Interpreting TRIX
TRIX can be presented as a line chart or a histogram, offering valuable insights into price momentum and potential trend reversals. Traders typically focus on the following signals when analysing TRIX –
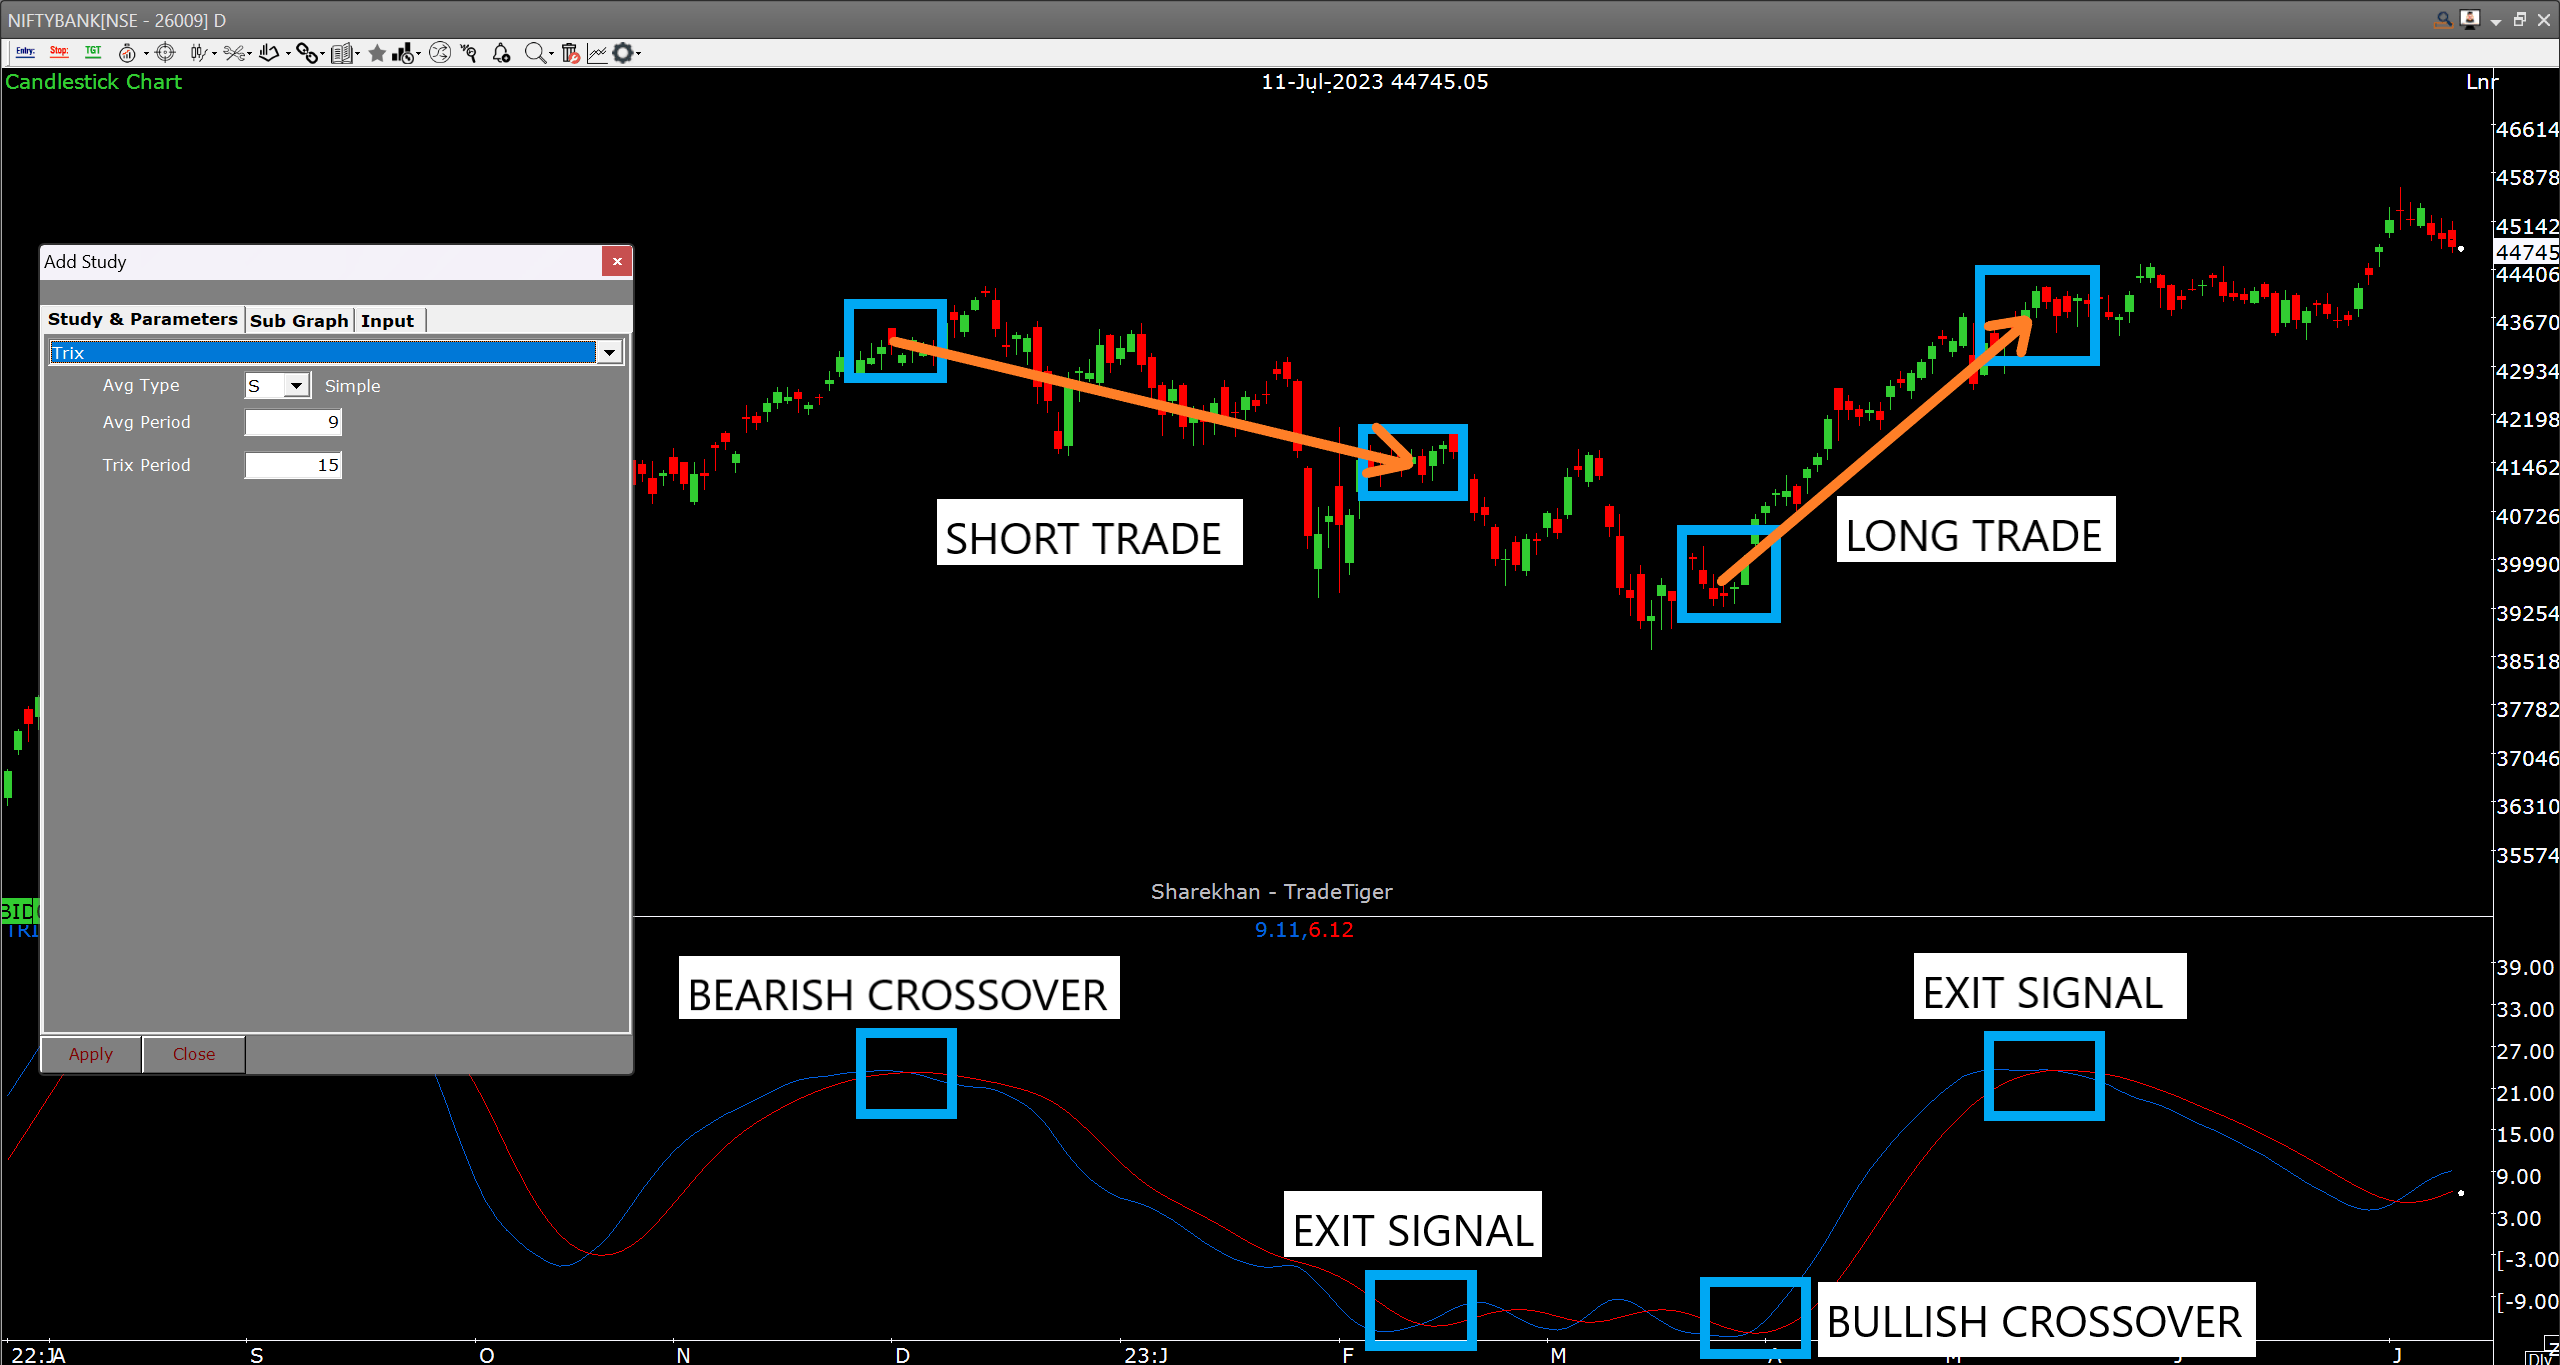
- Signal Line Crossovers – A bullish signal occurs when the TRIX line crosses above the signal line, indicating potential upward price momentum. Conversely, a bearish signal is generated when the TRIX line crosses below the signal line, suggesting potential downward price momentum. Traders often utilise a shorter-term signal line, such as a 9-period TRIX signal line, to enhance the clarity of these crossovers.
- Divergence – Divergence between the TRIX indicator and price action can provide significant insights into potential trend reversals. A bullish divergence occurs in trading when the price drops to form lower lows, while the TRIX indicator forms higher lows. It indicates a possible upward reversal in the market and should be closely monitored by traders. On the other hand, a bearish divergence occurs when the price includes higher highs while the TRIX indicator forms lower highs, signalling a potential downward reversal.
- Overbought and Oversold Conditions – TRIX can also be utilised to identify overbought and oversold conditions in the market. When the TRIX line reaches extreme levels, surpassing a predetermined threshold, it suggests an overbought condition. Conversely, when the TRIX line falls below a certain threshold, it indicates an oversold condition, potentially signalling a buying opportunity.
Leveraging TRIX in Trading Strategies
TRIX can be employed in various trading strategies, including trend following, reversal trading, and as a confirmation tool in conjunction with other technical indicators. It is essential to combine TRIX with other relevant technical analysis tools, consider fundamental factors, and adapt it to suit your preferred trading style.
Summary
The Triple Exponential Average (TRIX) indicator offers a unique perspective on price momentum and trend reversals. By analysing the TRIX line, signal line crossovers, divergences, and overbought/oversold conditions, traders can make informed decisions and potentially capitalise on market opportunities. However, like any technical analysis tool, TRIX should be used with other indicators, risk management techniques, and a comprehensive market analysis approach to increase the probability of successful trades. Incorporating TRIX into your trading repertoire can provide a valuable edge in navigating the complexities of financial markets and enhancing your trading outcomes.