A moving average is a technical indicator which is calculated by levelling the data of price to get a frequently updated average price which is plotted on the technical graph.
The Simple Moving Average or Moving Average is an arithmetic average of prices over a fixed period.
The Exponential Moving Average uses statistical methods to place a higher weightage on recent prices over old prices which are computed in the fixed period.

The moving average is a lagging indicator because its computation is based upon historic prices.
Moving Averages are crucial for traders as they assist you in identifying the trend of the stock. The moving average also determines the buying and selling conditions of the stock which helps you in understanding if the stock is oversold and ready to be bought or if the stock is overbought and the existing quantities must be sold.
If the period for a moving average is high, then the average plotted will contain a higher lag. Hence 50-day and 100-day moving average are frequently used by traders as they give faster signals.
A rising moving average depicts that the stock is up-trending, whereas a declining moving average depicts that it is down-trending.
An upward momentum is generated with a bullish crossover, which happens when a short-term moving average crosses over a longer-term moving average.
A downward momentum is generated with a bearish crossover, which happens when a short-term moving average crosses under a longer-term moving average.
A Simple Moving Average (SMA) is calculated by taking the arithmetic mean of a given set of values over a specified period. A set of numbers, or prices of stocks, are added together and then divided by the number of prices in the set.

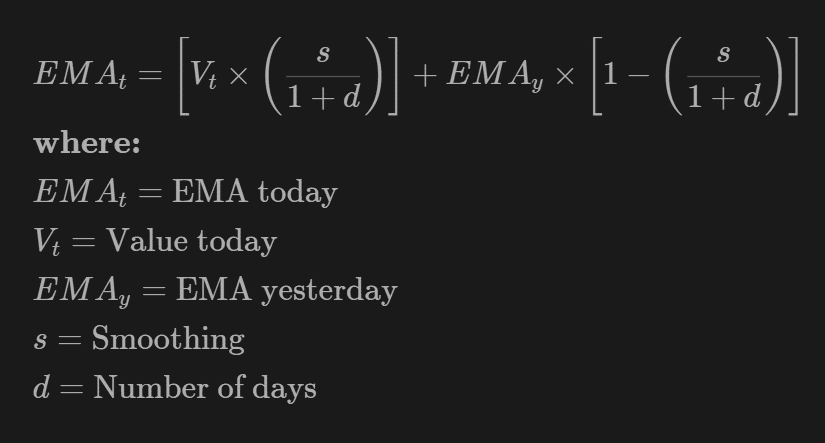
The exponential moving average gives more weight to recent prices in an attempt to make them more responsive to new information. To calculate an EMA, the simple moving average (SMA) over a particular period is calculated first.
Then calculate the multiplier for weighting the EMA, known as the “smoothing factor,” which typically follows the formula: [2 / (selected time period + 1)].
The smoothing factor is combined with the previous EMA to arrive at the current value. The EMA thus gives a higher weighting to recent prices, while the SMA assigns an equal weighting to all values.
A moving average (MA) is a stock indicator typically used in technical analysis to aide in smoothing the price data by computation of a frequently updated average price. A rising moving average depicts that the stock is up-trending, whereas a declining moving average depicts a down-trend. The exponential moving average is better than a simple moving average as it provides more weight to recent prices and shows a clear response to new information and trends.
Disclaimer: We do not endorse or encourage you to take trades or investment decisions based upon our posts/research, all of your trading and investment activities are your own and should be taken through consultation with reputed financial advisors. The analysis posted on this website has been created by involving multiple mediums which are present over the Internet.