Pivot Points are certain price levels which are used as targets or as a probable indicator for the movement of the market. The calculation of pivot points is an average of significant prices (high, low, close) from the data of the market in the previous trading sessions. If the market price is trading higher than the pivot point it is considered as a bullish market, whereas the price trading below the pivot point is considered as a bearish market.
It is essential to calculate additional levels of support levels which are below the pivot point and resistance levels which are above the pivot point. The support and resistance levels are calculated by subtracting or adding price differentials which are calculated from the previous trading ranges of the market.
A pivot point and its associated support and resistance levels are typically noted as reversal points for the direction of price movement in a market. In an up-trending market, the pivot point and the resistance levels may denote a ceiling level in price above which the uptrend is no longer sustainable, and a reversal may occur. In a down-trending market, a pivot point and the support levels may represent a low-price level of stability or a resistance to further decline.

Calculation
The most common method of calculating the Pivot Point (P) is the arithmetic average of the High (H), Low (L) and Close (C) prices of the market in the previous period:

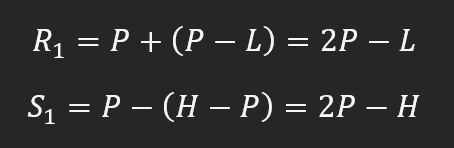
The first and most significant level of resistance (R1) and support (S1) is obtained by recognizing the lower and the upper halves of the previous trading range, which are calculated as:
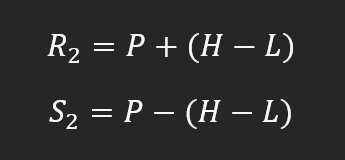
The second set of resistance (R2) and support (S2) levels are calculated from the full width of the previous trading range as:
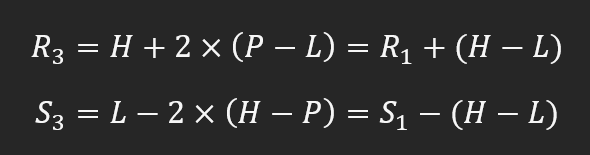
The third set of another higher resistance level (R3) and a yet lower support level (S3) is calculated by doubling the range added and subtracted from the pivot point:
Characteristics of Pivot Points
Intraday Traders should set the Time Period as Daily for Pivot Points and use the 5-minute, 10-minute or 15-minute price charts.
Swing or Positional Traders should set the Time Period as Weekly for Pivot Points and use the Daily or Weekly price charts.
The pivot point denotes a level of highest resistance or support by considering the entire market condition.
If the market is sideways, the price will fluctuate constantly around the pivot point until an occurrence of price breakout.
The price trading above or below the pivot point depicts the overall sentiment of the market.
Pivot Points is a leading indicator which provides potentially new market highs or lows within a given time frame to traders in advance.
Unlike other indicators or oscillators, Pivot Points are static and remain at the same prices throughout the day. Hence traders can use these levels to plan their trading in advance.
The support and resistance levels which are calculated from the pivot point and the previous market range may be used as exit points of trades.
If the market is up-trending and breaks through the pivot point, the first resistance level is often a good target to close a long trade, as the probability of resistance and reversal increases greatly.
Similarly, if the market is down-trending and falls as low as to the level of R3 then it is a good opportunity to close a short trade as the probability of support and reversal is high at this level.
Combining pivot points with other trend indicators is common practice with traders such as a SuperTrend of a Moving Average
A pivot point which overlaps or converges with a 100-period or 200-period moving average (MA), or Fibonacci extension level, marks a highly strong support/resistance level.