The Average Directional movement indeX (ADX) is an indicator of the strength of the trend in a series of prices of a financial instrument. It was developed in 1978 by J. Welles Wilder through his book “New Concepts in Technical Trading Systems”, the same person who invented the Average True Range (ATR) indicator. The ADX is a popular indicator for technical analysis as it provided to traders through various trading platforms.
The ADX is a technical analysis indicator which is used to determine the strength of the trend. The two trends are bullish trends and bearish trends which are associated with the Positive Directional Indicator (PDI) and the Negative Directional Indicator (NDI). The formula combines them and smooths the result with a smoothed moving average. Hence, we can observe three separate lines plotted by the ADX indicator. The ADX helps traders to determine the strength of the trend, while PDI and NDI help determine trend direction.
The value of the ADX is proportional to the slope of the trend. The slope of the ADX line is proportional to the acceleration of the price movement (changing trend slope). If the trend is a constant slope, then the ADX value tends to flatten out.

Calculation
To calculate the PDI and NDI, the system needs the price data consisting of high, low, and closing prices each period (data of each day). The system first calculates the directional movement (PDM and NDM):

After selecting the number of periods (Wilder used 14 days originally), the PDI and NDI are:

The smoothed moving average is calculated over the selected number of periods and the average true range is a smoothed average of the true ranges. Then ADX is calculated as:
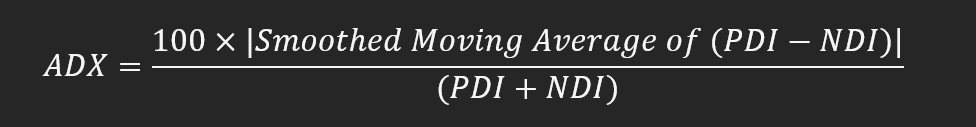
This calculation can be varied by using different types of moving averages such as an exponential moving average or a weighted moving average or an adaptive moving average.
Characteristics of ADX
ADX should be used on Daily and Weekly chart timeframes, hence use ADX for swing trades.
ADX determines only the strength of the trend and not the direction or momentum of the trend.
ADX is a lagging indicator wherein the trend must have already initiated before the indicators gives a signal.
ADX value ranges between 0 to 100.
When ADX is below 20, it indicates that the trend is absent, and the market is sideways.
When ADX is between 20 to 40, it indicates a trending market (either up-trending or down-trending)
When ADX is above 40, it indicates that the current trend is unsustainable and there is a high probability of a reversal of the current trend.
Whenever the ADX lowers down from high values, then the current trend may be weakening.
Crossovers of PDI and NDI can be used as trade signals for entry and exit.
For a bullish crossover: if the PDI line crosses above the NDI line and the ADX is above 25, then it is a bullish signal for a long trade.
For a bearish crossover: if the NDI line crosses above the PDI line and the ADX is above 25, then it is a bearish signal for a short trade.
Crossovers can occur frequently due to false signals being generated when ADX is under 25 which creates confusion and results in losses.