Technical analysis is a vital element of trading and investment strategies. Traders use various tools and indicators to analyze price movements and make informed decisions. One such tool is the Klinger Oscillator, a lesser-known but influential indicator that can provide valuable insights into market trends and potential reversals. Let us understand the Klinger Oscillator by exploring its origins, calculation, interpretation, and practical application.
Origins
Developed by Stephen Klinger, a former hedge fund manager, the Klinger Oscillator was introduced in the early 1990s to improve existing volume-based indicators. Klinger believed that incorporating price and volume information would accurately represent market trends and help traders identify potential turning points.
Calculation
The Klinger Oscillator combines two key components: the Volume Force (VF) and the Volume Force Exponential Moving Average (VFEMA). Let’s break down the calculation:
1) Volume Force (VF) –
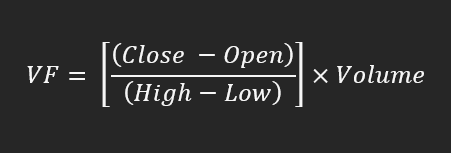
2) Volume Force Exponential Moving Average (VFEMA) –

EMA stands for Exponential Moving Average. The short-term period is typically 34 days, while the long-term period is usually 55 days. The difference between these two EMAs creates the Klinger Oscillator, which can be plotted as a line graph on a price chart.
Interpretation
The Klinger Oscillator serves as a momentum and volume indicator to reveal the strength of price movements and potential trend reversals. The following interpretations can be made:
1) Positive Klinger Oscillator
When the Klinger Oscillator is positive, it suggests that buying pressure dominates the market. It can signal an upward trend or bullish momentum.
2) Negative Klinger Oscillator
Conversely, a negative Klinger Oscillator indicates that selling pressure is prevailing. It could mean a downward trend or bearish momentum.
3) Divergence
The divergence between the Klinger Oscillator and price movements can highlight potential trend reversals. A bullish divergence occurs when prices decline while the oscillator rises, indicating a possible bullish reversal. On the other hand, a bearish divergence occurs when prices rise while the oscillator is falling, suggesting a potential bearish reversal.

Applications
Traders often use the Klinger Oscillator and other technical analysis tools to confirm their observations. The applications are as follows:
1) Confirming Trends – Use the Klinger Oscillator to validate trends identified by other indicators or chart patterns.
2) Identifying Reversals – Watch for bullish or bearish divergences between the oscillator and price to anticipate trend reversals.
3) Entry and Exit Points – Utilize the Klinger Oscillator to time entry and exit points for trades. For example, a positive crossover above zero could signal a potential buying opportunity.
4) Risk Management – Combine the Klinger Oscillator with risk management strategies to improve the accuracy of your trading decisions.
Summary
The Klinger Oscillator may not be as widely known as other technical indicators, but its unique approach to combining price and volume data can provide valuable insights into market dynamics. Traders can enhance their ability to make better trading decisions by comprehending this tool’s calculation, interpretation, and practical application. Please understand that no indicator is infallible, and it’s always wise to use the Klinger Oscillator with other forms of analysis for a comprehensive market view.
Disclaimer: We do not endorse or encourage you to take trades or investment decisions based upon our posts/research, all of your trading and investment activities are your own and should be taken through consultation with reputed financial advisors. The analysis posted on this website has been created by involving multiple mediums which are present over the Internet.