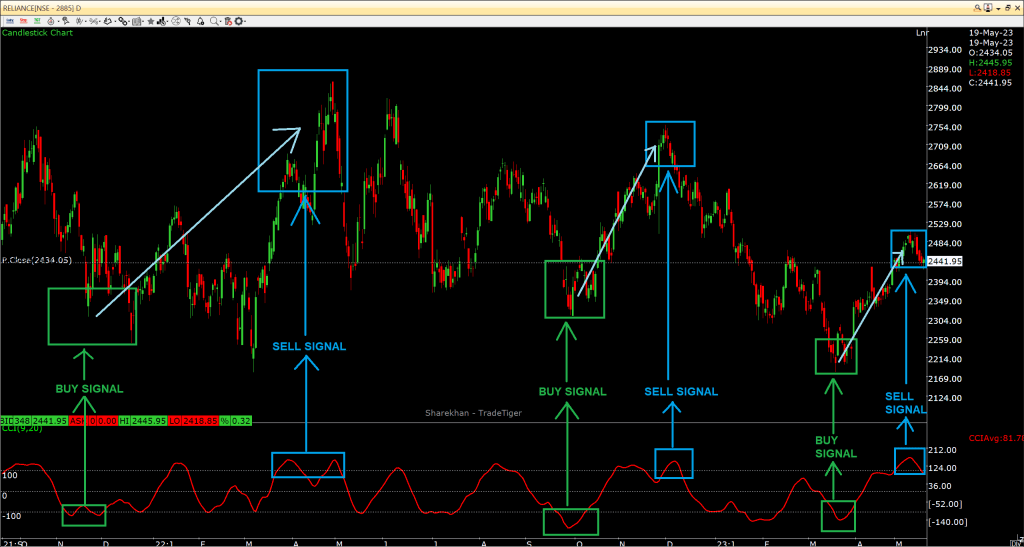
The Commodity Channel Index (CCI) is a momentum oscillator helps traders in realizing overbought and oversold levels by computing an asset’s movements from its statistical mean. CCI is a popular technical indicator due to its versatility. CCI also enables traders to identify reversals and divergences. This indicator was originally designed to be used for identifying trends in commodities, but it is used in multiple financial instruments.
The Commodity Channel Index (CCI) was created by Donald Lambert and introduced in 1980. It first appearance in Commodities Magazine.

Calculation
CCI measures an asset’s variation from the statistical mean.
The CCI is calculated as the difference between the typical price of a commodity and its simple moving average, divided by the mean absolute deviation of the typical price. The index is usually scaled by an inverse factor of 0.015 to provide more readable numbers:

where

CCI Notes and Usage
CCI compares the current price to an average price over a period of time. The indicator moves above or below zero, moving into positive or negative territory. Majority of the values fall between -100 and +100, about 25% of the values fall outside this range which denotes weakness or strength in the price movement.
CCI can be deployed on multiple timeframes. A long-term chart such as a Daily or Weekly is used to establish the dominant trend, while a short-term chart such as intraday charts establish pullbacks and entry into the trend.
When the CCI moves above +100, this denotes an upward trend, and traders can lookout for long signals on the shorter-term chart. The trend is supposedly bullish until the longer-term CCI dips below -100.
CCI is highly subjective while identifying overbought and oversold zones. The indicator is unbound, hence historical overbought and oversold zones may have minor impact in the future.
CCI is a lagging indicator. Hence at times it will provide poor signals. A rally to signal a new trend may be late, as the price has may already have performed a move and may begin to reverse. Therefore, CCI is best used in symbiosis with price analysis and technical analysis or indicators for confirmation or rejection of CCI signals.
Divergence between price and the CCI’s reading should be monitored. Divergences between CCI and price action can be a signal that changes in trend may be forthcoming. Bullish CCI Divergence occurs when price makes a lower low while CCI makes a higher low. Bearish CCI Divergence occurs when price makes a higher high while CCI makes a lower high.
The Commodity Channel Index indicator has been in use for over 30 years. Hence the CCI has a great role in technical analysis. It is important for strong momentum for confirmation of CCI signals.
Disclaimer: We do not endorse or encourage you to take trades or investment decisions based upon our posts/research, all of your trading and investment activities are your own and should be taken through consultation with reputed financial advisors. The analysis posted on this website has been created by involving multiple mediums which are present over the Internet.
