Average true range (ATR) is a technical analysis volatility indicator which was initially developed by J. Welles Wilder, Jr. in his book named New Concepts in Technical Trading Systems mainly for the commodities segment. The ATR cannot impart a signal for the trend of the price, it primarily displays the degree of volatility of the price. The value of the ATR is an N-period smoothed moving average (SMMA) of the true range values. Wilder had recommended a 14-period smoothing.
The true range indicator is calculated using the greatest of the following: current high less the current low; the absolute value of the current high less the previous close; and the absolute value of the current low less the previous close. The ATR is then a moving average, generally using 14 days of the true ranges.
The ATR tells you the average of the total movement (both up-move and down-move) in the price of an asset based on a historical period of n days.

Calculation of ATR
For the calculation the ATR we need to discover the True Range. True Range considers the greatest of the current period high/low range and the previous period close (if required).
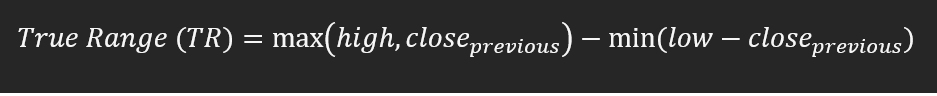
The True Range (TR) is the largest of the following:
Current Period High − Current Period Low
Absolute Value (abs) of the Current Period − Previous Period Close
Absolute Value (abs) of the Current Period Low − Previous Period Close
These 3 calculations are required and then their values are compared against each other with the formula as follows:

The above formula is simplified as follows:
The current ATR of present time t is calculated (by means of an exponential moving average) using the following formula:
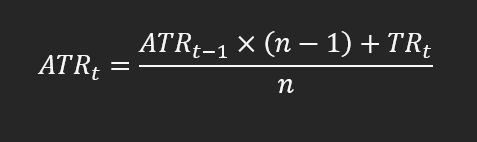
The first ATR value can be calculated by using the arithmetic mean formula:

This primary value is the very first from the beginning of the time series (not the most recent) and is n periods from the starting point of the chart.
Characteristics of ATR:
The Average True Range indicator identifies timeframes having high and low volatility in the market. High volatility means an unstable market with heavy volumes causing radical price movements, whereas low volatility is describes a calm market with minor price movements.
By measuring the market volatility, traders can identify buy and sell signals and, most importantly the risk potential of the market or any particular stock.
Markets or stocks with rampant movement in their price provide a higher risk-to-reward potential. This is due to the fact that prices rise and fall in a short period, hence the trader acquires a higher number of opportunities to buy or sell.
When a market becomes highly volatile, the ATR tends to peak by rising in its value. High ATR values are usually created from a sharp/rapid advance or decline in prices and are unlikely to be sustained for extended periods.
As the volatility subsides, the value of ATR decreases. Low ATR is caused by a series of periods having small price ranges (calm days). Such low ATR values are typically found during extended sideways price action; hence the volatility is lower. A prolonged period of low ATR values may indicate a consolidation area and the possibility of a continuation move or reversal.
The ATR may be used by traders for entry and exits for their trades. ATR can be useful supportive tool which can be add to a trading system. It was created to enable traders to accurately measure the volatility of an asset. The indicator does not indicate the price direction; instead, it is used primarily to measure volatility caused by rapid price movements, gaps and limit up or down moves.